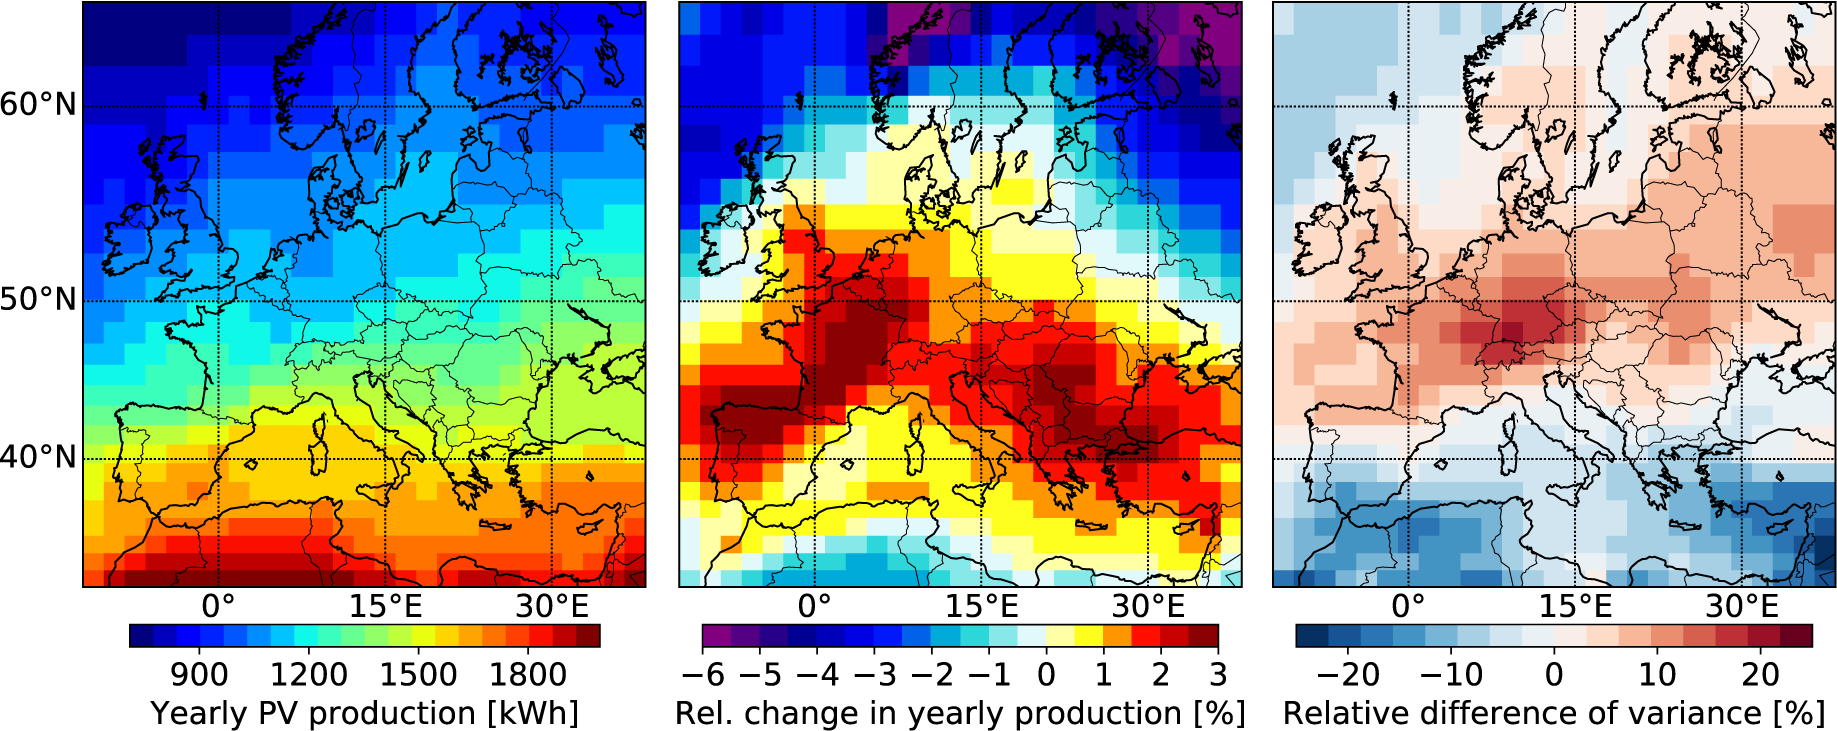
Results for present yearly total PV potential and future relative change and variance compared to the present under the RCP8.5 climate change scenario. Maps show the ensemble mean of the CMIP5 models of the total PV potential (a) for the present (2007–2027), (b) relative difference in yearly sum of produced power, and (c) intra-annual (seasonal) variance between the present (2007–2027) and future (2060–2080) time periods. Adapted from Müller, Folini, Wild and Pfenninger (2019).
Photovoltaic power output changes locally by −6% to +3% on annual and −25% to +10% on monthly scales, when comparing present (2007-2027) to future (2060-2080) with a CMIP5 climate model ensemble for the RCP8.5 climate change scenario. Southern Europe sees increased output, while northern Europe sees a decrease; overall, photovoltaic electricity is a no-regrets investment in Europe irrespective of climate change. → Müller, Folini, Wild and Pfenninger (2019).