9 Jun 2022 #spotlight

Diversity of options to eliminate fossil fuels and reach carbon neutrality across the entire European energy system

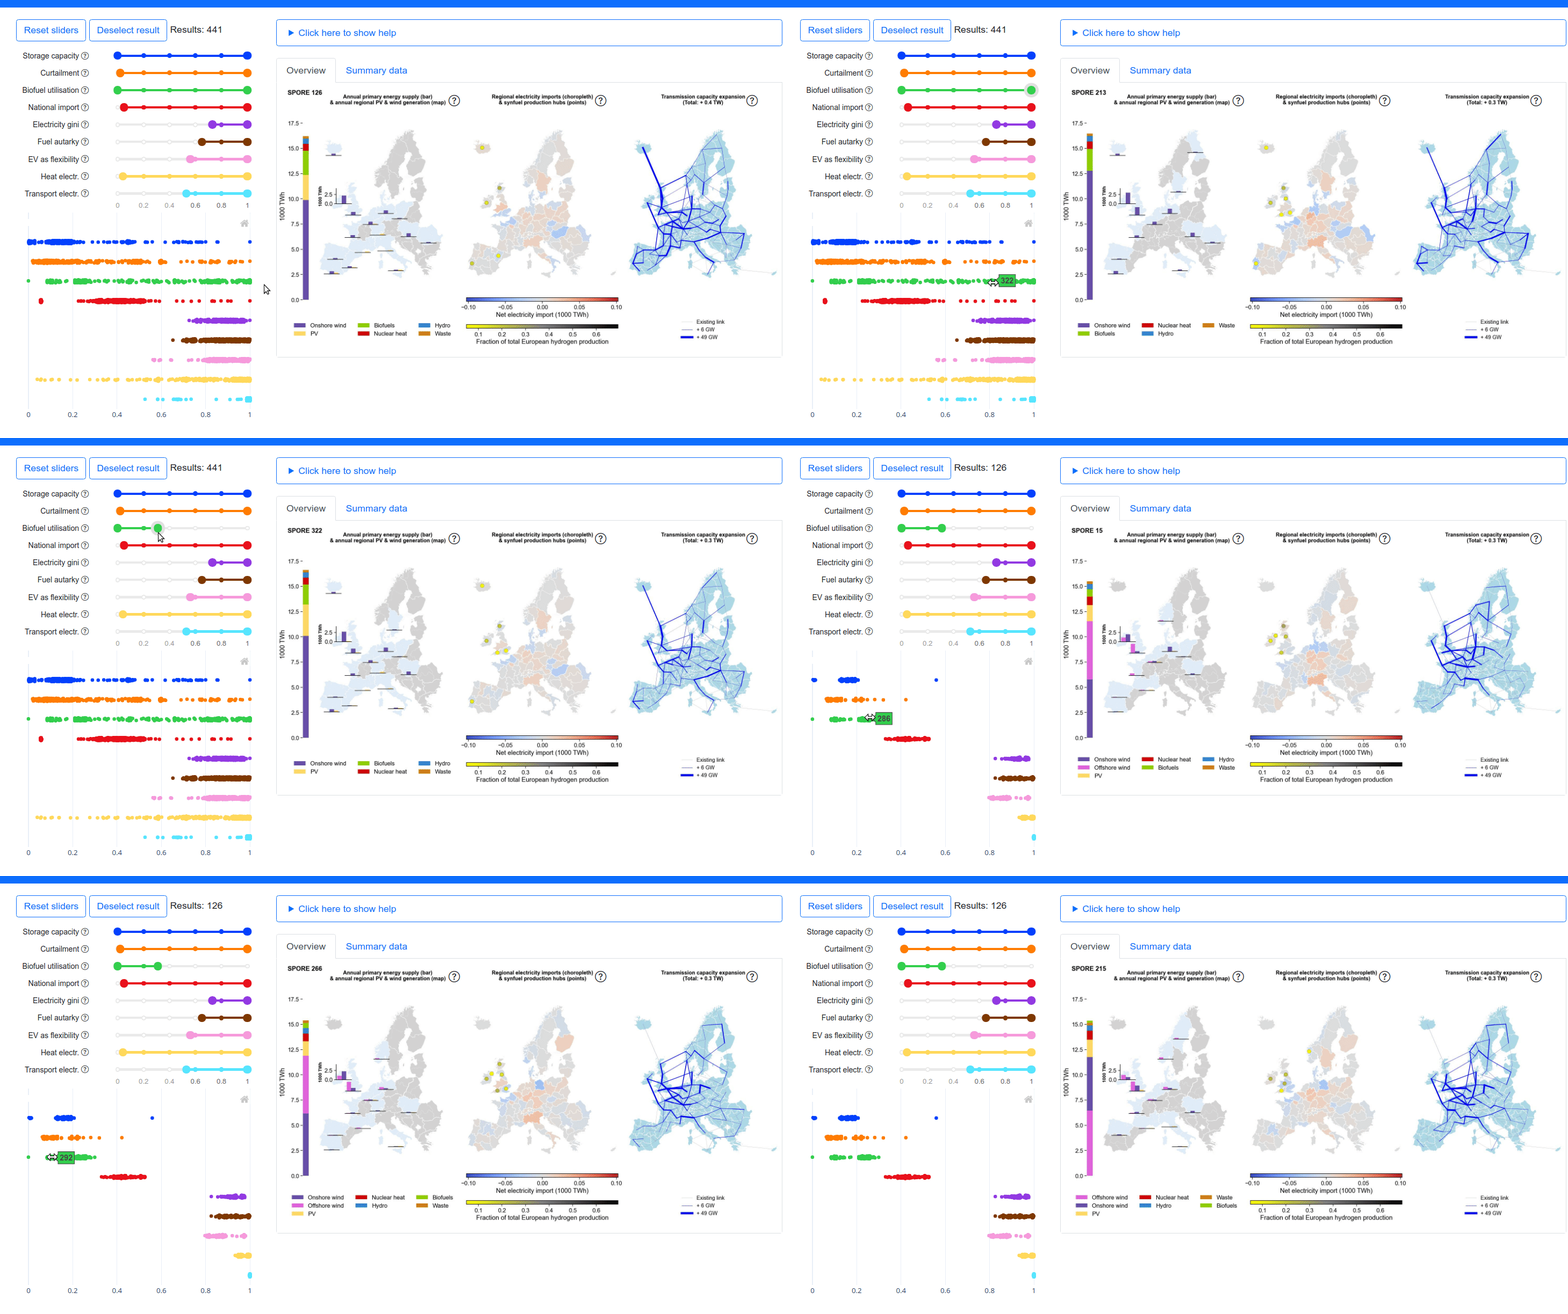
The interactive scenario explorer in action.

The interactive scenario explorer in action.

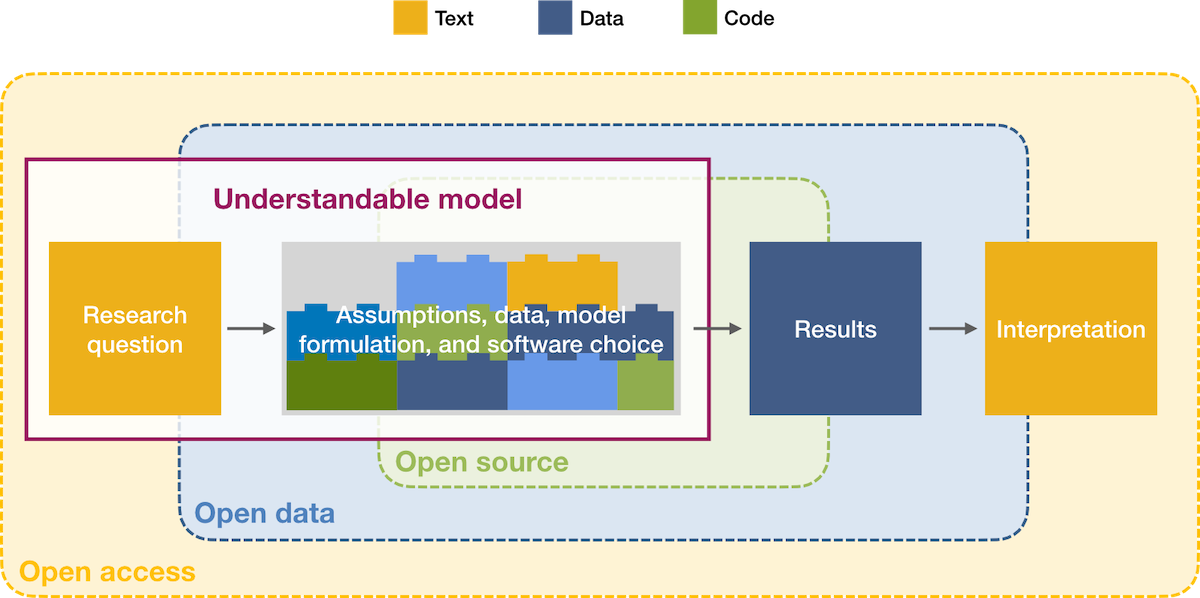
We show a diversity of untold options to meet all energy demand based on renewable energy, with a complete phase-out of oil and gas imports. The results can be viewed in an interactive scenario explorer. With a marginal increase above optimal cost, the reliance of an energy self-sufficient Europe on specific solutions, like biofuels, battery storage, transmission expansion, or heat electrification, can vary from not being used at all to being key to system stability. → Pickering, Lombardi and Pfenninger (2022), Joule.

3 Aug 2020 #spotlight

Trade-offs between geographic scale, cost, and infrastructure requirements for fully renewable electricity in Europe

Source: Adapted from Tröndle, Marelli, Lilliestam and Pfenninger (2020).

Source: Adapted from Tröndle, Marelli, Lilliestam and Pfenninger (2020).

Renewable electricity supply in Europe would be cheapest with a continent-wide optimised system where wind and solar power are deployed at the best locations. However, it is also possible to build nationally or subnationally balanced supply systems with cost penalties of 20% or less. Such a low-cost but regionally balanced electricity supply requires continental-scale balancing of renewable fluctuations and an expansion of cross-border transmission capacities, but not necessarily an overall large transmission grid. → Tröndle, Marelli, Lilliestam and Pfenninger (2020), Joule.

9 Jul 2019 #spotlight

China's PV potential with pollution-free 1960s surface radiation

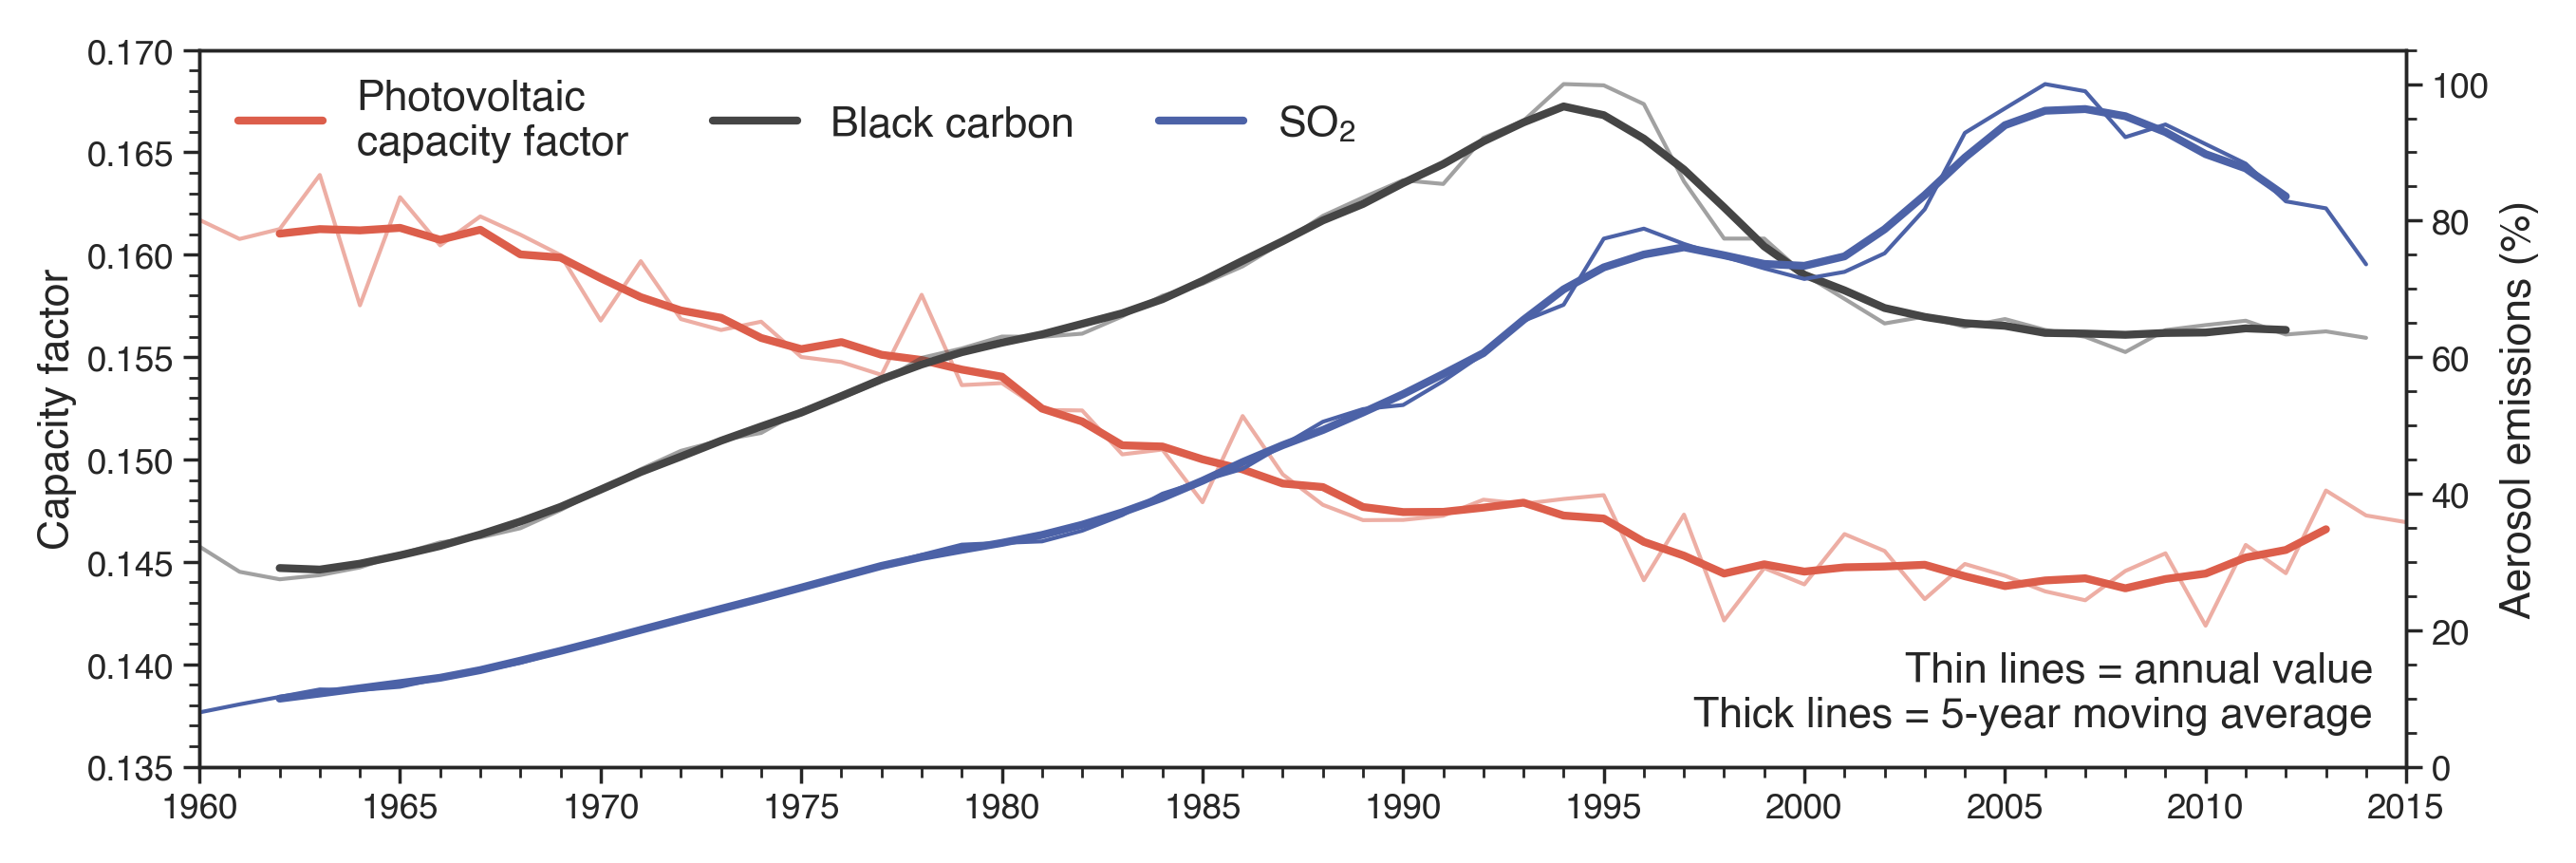
Historic (1960 – 2015) capacity factors (red) and SO2 (blue) and black carbon (black) emissions in China as a percentage of peak emissions in 1994 and 2005 respectively. Thin lines are annual, thick lines 5-year moving mean values. Adapted from Sweerts, Pfenninger, Yang, Folini, van der Zwaan and Wild (2019).

Historic (1960 – 2015) capacity factors (red) and SO2 (blue) and black carbon (black) emissions in China as a percentage of peak emissions in 1994 and 2005 respectively. Thin lines are annual, thick lines 5-year moving mean values. Adapted from Sweerts, Pfenninger, Yang, Folini, van der Zwaan and Wild (2019).

Using solar radiation data from 119 stations across China we show that photovoltaic electricity potential decreased on average by 11–15% between 1960 and 2015. Given the observed relation between surface radiation and emissions of sulphur dioxide and black carbon, reducing air pollution should let surface radiation increase. Reverting back to 1960s radiation levels could yield a 12–13% increase in China’s solar electricity generation. → Sweerts, Pfenninger, Yang, Folini, van der Zwaan and Wild (2019), Nature Energy.

29 Mar 2019 #spotlight

Photovoltaic electricity is a no-regrets investment in Europe irrespective of climate change

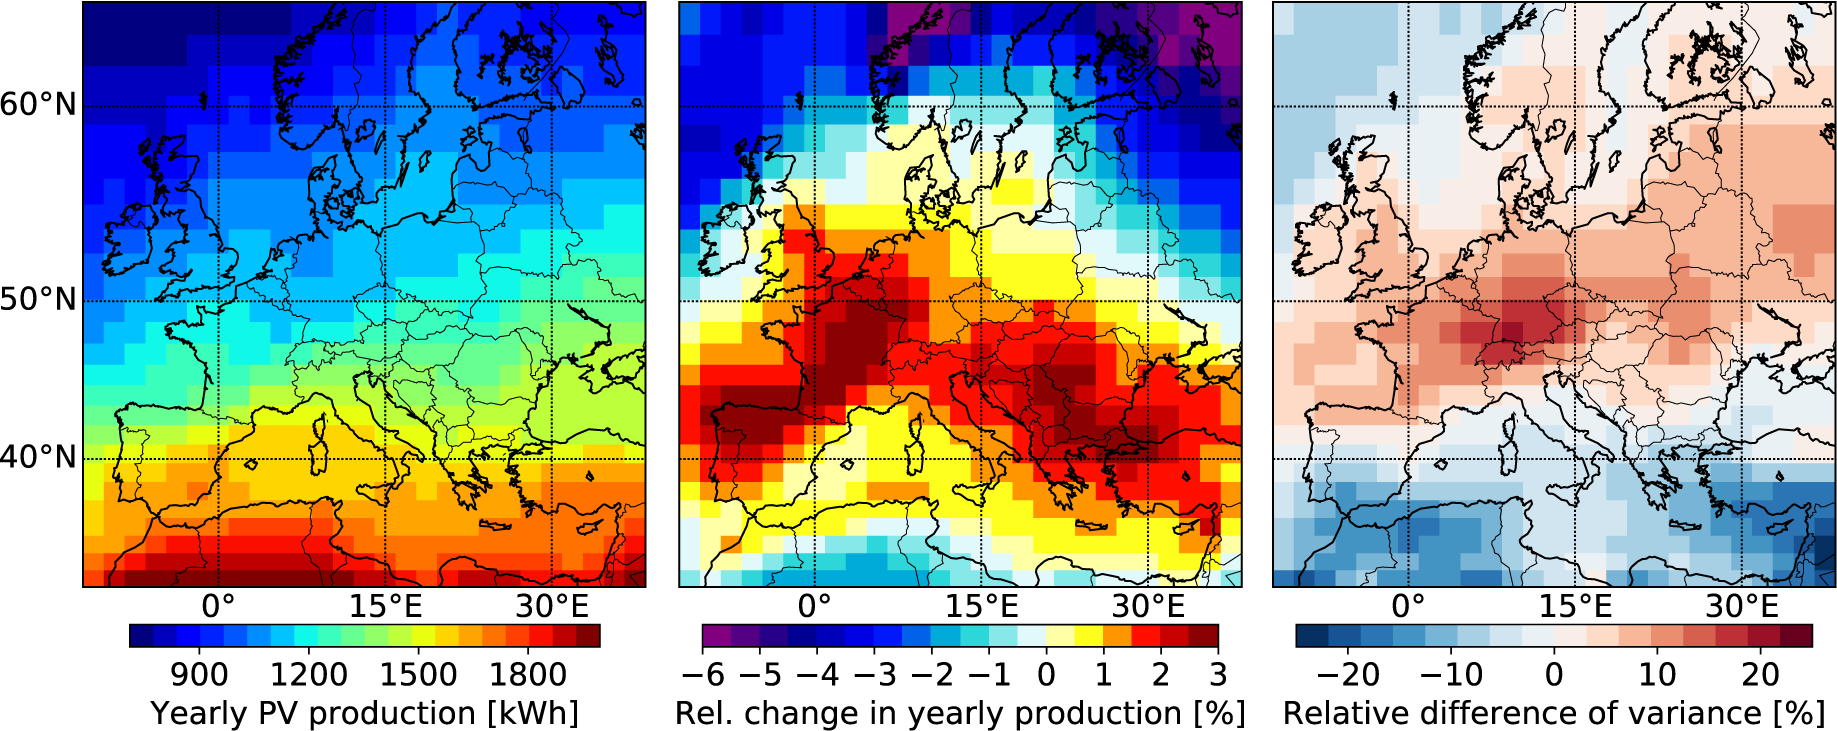
Results for present yearly total PV potential and future relative change and variance compared to the present under the RCP8.5 climate change scenario. Maps show the ensemble mean of the CMIP5 models of the total PV potential (a) for the present (2007–2027), (b) relative difference in yearly sum of produced power, and (c) intra-annual (seasonal) variance between the present (2007–2027) and future (2060–2080) time periods. Adapted from Müller, Folini, Wild and Pfenninger (2019).

Results for present yearly total PV potential and future relative change and variance compared to the present under the RCP8.5 climate change scenario. Maps show the ensemble mean of the CMIP5 models of the total PV potential (a) for the present (2007–2027), (b) relative difference in yearly sum of produced power, and (c) intra-annual (seasonal) variance between the present (2007–2027) and future (2060–2080) time periods. Adapted from Müller, Folini, Wild and Pfenninger (2019).

Photovoltaic power output changes locally by −6% to +3% on annual and −25% to +10% on monthly scales, when comparing present (2007-2027) to future (2060-2080) with a CMIP5 climate model ensemble for the RCP8.5 climate change scenario. Southern Europe sees increased output, while northern Europe sees a decrease; overall, photovoltaic electricity is a no-regrets investment in Europe irrespective of climate change. → Müller, Folini, Wild and Pfenninger (2019).